View PDF Version of Newsletter
April 5, 2019
Robert Bingham, CFA, President and Chief Investment Officer
John Wright, Principal, Director of Research
“Based on history, we get another year and a half or so before recession.”
– Mariann Montagne, Gradient Investments Portfolio Manager, 3/27/19
When does the next recession arrive? Not for another year and a half, according to Gradient Investments’ Mariann Montagne. While there are many other answers to that question, the actual answer depends on the economic trends and data that will be forthcoming over the next several months, or years. Job growth trends, consumer spending levels, new housing starts, capital spending activity, corporate earnings and international trading activity are a few of the economic variables that will shape the future and be closely studied by investors. Together, the economy’s many components will influence consumer confidence levels and spending decisions by both businesses and individuals. In turn, demand for goods and services will grow or contract accordingly. And gross domestic product numbers will reflect the cumulative results of these many decisions individuals and businesses make every day.
Investors try to anticipate these trends. Bond investors try to anticipate future changes in interest rates and credit ratings; stock investors try to anticipate future growth trends and future cash flows for companies. All told, the markets try to predict the future, and interest rate changes are a part of this process. For many, interest rate levels, credit trends and future expectations about interest rates form the guideposts for the markets.
Given the weakening 4th quarter trends, the markets sent the Federal Reserve a message last December. Stocks were aggressively sold, and bonds were bought as expectations for economic growth slowed. Accordingly, investors expected interest rates to decline in that environment–rather than to increase, which they did on December 19th. The Federal Reserve noticed these market shifts and subsequently announced they would be “patient” with their plans to increase interest rates in 2019. Then again on March 20th, after the 10-year bond had fallen from 3.23% in November to 2.42% in March, the Federal Reserve signaled they would most likely not raise interest rates during the rest of 2019.
These statements by the Federal Reserve are not monumental in and of themselves. Rather, they shape and corroborate investor expectations for growth and how interest rates may trend. And as March ended, renewed concerns about a pending recession took the yield on the 10-year Treasury bond down to 2.37%, which was lower than the yield on the 3-month Treasury bill. This inversion of the yield curve increased investor concern that the markets were predicting a recession. In large part this occurred because the Federal Reserve stated on March 20th, “that growth of economic activity slowed.”
Investors initially viewed this announcement from a bearish perspective since economic growth trends were weakening, interest rates were falling and a recession might be looming. But with subsequent announcements as April began that housing starts had increased to a one-year high and that manufacturing indices were showing some renewed strength, stocks pushed higher and delivered the best 1st quarter in twenty years.
For the 1st quarter, the S&P 500 Index was up 13.6% when including dividends, while the bond market also rallied by 2.1%, as measured by the Bloomberg Barclays US Treasury Index. This renewed market strength suggests that any recession is farther away than may have previously been anticipated. However, expectations can change in nanoseconds; so just what might a recession look like?
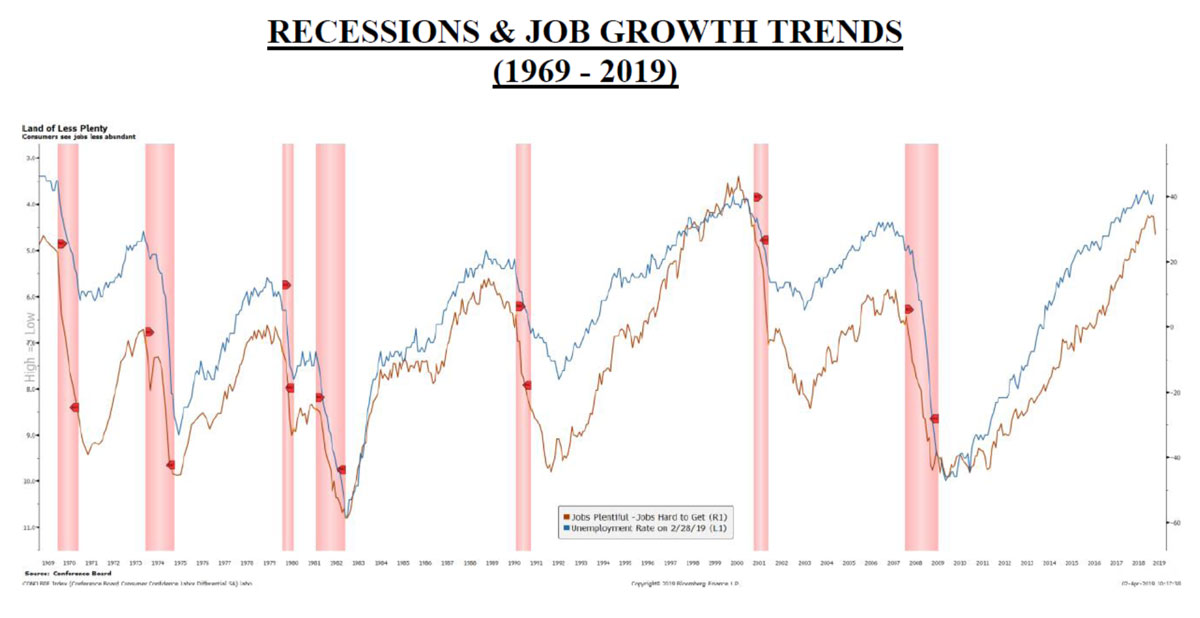
The following graph shows the frequency and breadth of the past seven recessions the United States has experienced during the last 50 years. Notably, the 2008 recession stands out for both its severity and its breadth, as it lasted 18 months. The two previous recessions of 2001 and 1990 each lasted less than one year. That was true for the 1980 recession as well, while the recessions of 1981, 1973, and 1970 each lasted for a year or longer. On average, these 7 recessions lasted for 13 months. During those seven recessions, the S&P 500 dropped on average by 35% from peak to trough. Yet the worst decline was seen during the 2007 to 2009 time period. The more moderate recessions have generated a drop on average of 27% in the S&P 500 from peak to trough. Additionally, on average, the S&P 500 Index has appreciated 9.8% in the year and a half period prior to each of these seven recessions.
While each recession is different and caused by different factors, it is interesting to note that the United States has only had three recessions in the last 35 years. Yet during the previous 15-year period from 1969 to 1984, there were four recessions. And there were five recessions in the 20 years before that. JPMorgan economist, Dr. David Kelly, has argued that our economy today is less cyclical than the economy of the 1960s and 1970s. Specifically, consumer spending drives approximately two-thirds of today’s economy while the manufacturing sector now only drives about 13% of our economy. Historically, the following four sectors of the economy created 21% of the gross domestic product in the United States but were responsible for 60% of the changes to our GDP: Home building, capital spending, automobile purchases, and inventory growth are much less impactful today given the much larger contribution to our economy from the services sector. Hence, it is possible that recessions should be expected less frequently than was the case after WWII.
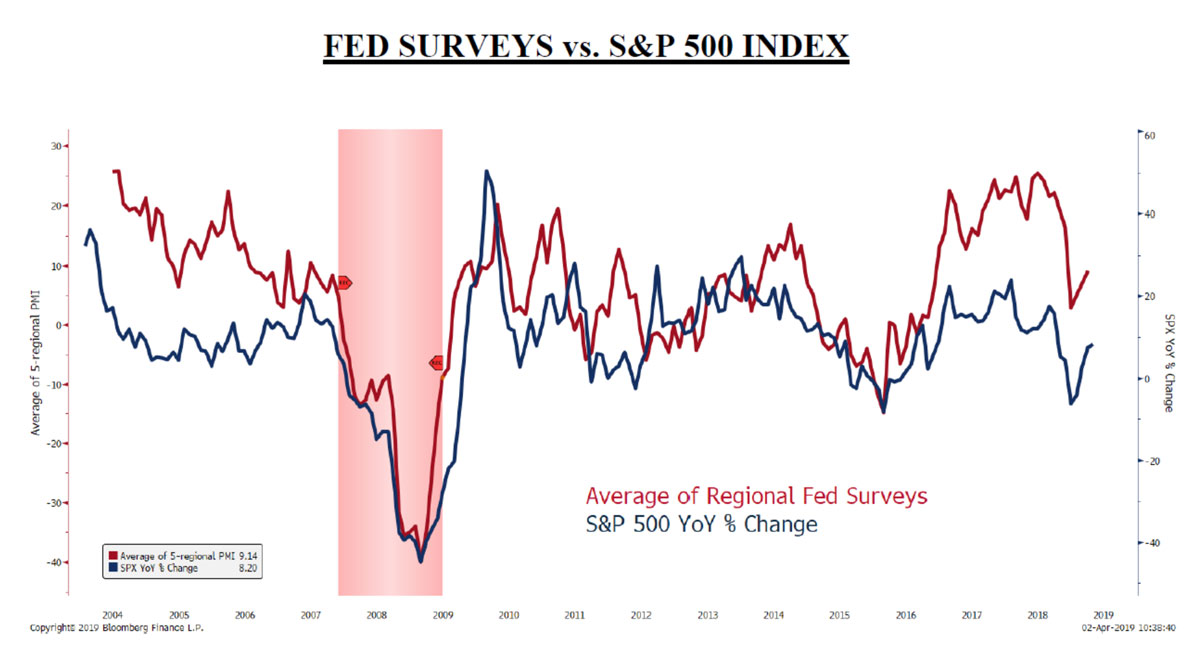
Economic data in early April was also more positive than negative. Construction spending showed improvement as state and local governments nationwide began record levels of new projects during February. Manufacturers in the United States reported more growth in new orders and employment in March. And these improving trends were reflected in the Federal Reserve’s five districts that generate business activity surveys. Bloomberg’s Ye Xie constructed the adjacent graph that shows the average reading for these five surveys and the recent improvement in that data. His graph also depicts a reasonably close correlation between the average of these Regional Fed Surveys and how the S&P 500 performs.
If those trends continue, the stock market may well continue to appreciate. The solid employment numbers released on April 5th also support this prospect. And that bond market inversion only lasted for five days. A long-lasting inversion over several months would be more telling.
However, some economic growth trends have slowed. Employment growth has slowed, while wages have risen. First quarter corporate earnings are expected to decline by 3.9% over 2018’s very strong results according to the data analytics company, FactSet. Others expect less of a decline. Yet this downtrend has been expected for some time given the weaker consumer spending levels seen in January and February. The Federal Government was also closed for 35 days in the first quarter, and that delayed many approvals and projects. In general, investors have been expecting a noisy first quarter that contributed to slower GDP growth. Analysts expect the slower economic growth to continue for most of 2019’s first half, before improving trends are seen in this year’s second half. Time will tell.
At SKY, we do not believe that a recession is imminent. We expect growth will continue, but not at last year’s 3% clip. We also believe that interest rate levels will trend higher. Hopefully, the U.S./China trade negotiators will settle on a compromise. However, it never hurts to be prepared for the worst and to be ready for any market downturn or prospective recession. Accordingly, households should assess their current spending levels, their overall needs and expected cash flow for the next 12 months. We can help with these calculations and provide some perspective if you’re interested in increasing your cash holdings. Having sufficient cash to pay next year’s bills is always a good thing. Higher-yielding dividend stocks can also provide some defense against a market downturn. So if you’d like to review your portfolio, please let us know.
And maybe, just maybe, the starting point for Mariann Montagne’s year and a half forecast has been delayed. Do give us a call if you have any questions.
The above summary/prices/quotes/statistics contained herein have been obtained from sources believed to be reliable but are not necessarily complete and cannot be guaranteed. Errors and omissions excepted.