View PDF Version of Newsletter
July 2, 2018
Robert Bingham, CFA, President and Chief Investment Officer
John Wright, Principal, Director of Research
“A lot of the investing public is piling into the same things. There’s a lot of sheep following one another.” – Jim Paulsen of the Leuthold Group, 6/29/18
After market declines in the first quarter, the second quarter brought a nice rebound. The S&P 500 Index increased by 3.4% and the Dow Jones Industrial Average increased by 1.3% when including dividend income. These increases followed the -0.8% and the -2.0% declines that the S&P 500 and Dow Jones indices delivered in this year’s first quarter.
The NASDAQ Composite Index however increased for the 8th straight quarter with a 6.6% gain, after its 2.6% gain in this year’s first quarter, when including dividend income. Year-to-date, the NASDAQ has appreciated by 9.4%, versus a 2.6% year-to-date gain for the S&P 500, and a year-to-date loss of 0.7% for the Dow Jones.
This discrepancy between the different market sectors is not unusual, but it has persisted for a longer than normal period. In the first quarter, nine of the eleven market sectors generated losses as the overall market corrected from its January 26th all-time high. The greater market volatility that emanated from that correction lessened in this year’s second quarter. And in this latest quarter, only 4 of the 11 market sectors had losses.
But the NASDAQ set a new all-time high on June 20, 2018 versus the S&P 500 Index, which closed the quarter off 5% from its high last January. For investors that have been concentrated in technology stocks, they should be pleased. Even more interesting is the fact that the S&P 500 Information Technology Index increased by 10.9% in this year’s first half, versus the 9.4% increase delivered by the NASDAQ. This outperformance of 150 basis points reflects the fact that the S&P 500 Technology Index is comprised of only 72 stocks, versus the 2,595 stocks that make up the NASDAQ.
An even narrower group of four stocks has had still more of an impact on the stock market’s performance over these last two years. The media affectionally gave these four stocks the acronym FANG, for Facebook, Amazon, Netflix and Google. And in the first six months of 2018, these four stocks delivered a 42% average gain with a 72% average gain from July 1, 2017 through June 30, 2018. Those heady figures have influenced market indices, investment results and the market’s underlying psychology.
Yet when the stock market is inordinately influenced by a small group of stocks, and/or one market sector, greater market volatility and market corrections usually follow. Pundits often site the “Dotcom Bubble” of 2000 or the “Financial Crisis” of 2008 as representative examples. Yet we would argue those two examples are more unusual and extreme cases. In 2000, the S&P 500 Index was valued at over 30 times earnings. And in 2008, industry leaders like Bear Stearns, Lehman Brothers, and AIG all failed.
At the end of 2018’s second quarter, the S&P 500 Index closed with a value of 20.7 times trailing earnings, and currently, corporate earnings trends remain very strong. This doesn’t mean we shouldn’t expect more market volatility and more market sell-offs, because clearly that is possible. We just don’t believe that a calamitous event is imminent. However, investors should review their portfolios, assess their needs, and make sure they are comfortable with the balance and risk of their holdings. Our clients should do the same, and they should communicate with us if there are questions and concerns.
Market shifts and market surprises always occur, and indeed we saw some shifts in 2018’s second quarter. For instance, the S&P 500 Energy Sector Index outperformed all the other S&P 500 sectors with a 13.5% gain in the second quarter. The S&P 500 Consumer Discretionary Sector (which includes Amazon) also outperformed the S&P 500 Technology Sector in the second quarter and even outperformed that sector for all of 2018’s first half. The S&P 500 Real Estate Sector Index was also up a strong 6.1% in the second quarter when including dividends.
So although the FANG stocks and technology stocks have been strong market leaders, we have seen some market shifts and rotations within the stock market. And that’s a healthy trend that suggests investors are not just chasing stocks, but are in fact trying to discern value. While we can argue that investors should do even more homework to decipher value, the market rotation among various market sectors suggests the stock market ended the second quarter with an upward bias. We’ll see what the third quarter brings.
In contrast, the bond market underperformed the stock market in the first half of 2018. The ICE BofA Merrill Lynch U.S. Corporate & Government index was down 1.9% for the first six months after being down 1.6% in the first quarter. As the adjoining graph shows, the bond market also exhibited some volatility in the second quarter, but no material change in valuation with the yield on 10-year U.S. Treasuries ending June at 2.85%.
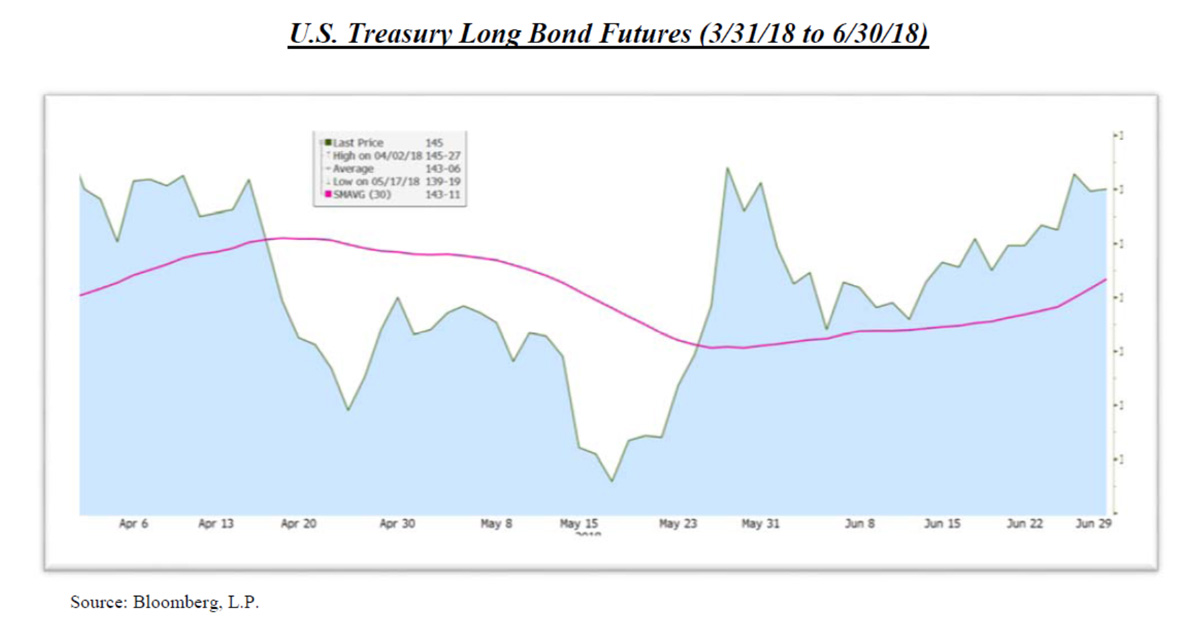
Now remember, most bonds decline in value when interest rate levels rise. And with the Federal Reserve increasing interest rates, most investors have been expecting bonds to decline in value. So, the bond market’s volatility reflects changing expectations for future interest rate levels. And investor expectations have fluctuated widely.
One year ago, as July 2017 began, the yield on the 10-year Treasury approximated 2.3%. On September 7, 2017, the 10-year Treasury had a 2.0% yield, and at the end of 2017, the yield on the 10-year Treasury approximated 2.4%. Investor expectations towards changes in interest rates were relatively benign last year.
But at the end of January, stronger-than-expected job growth and increased concerns about higher levels of inflation drove interest rates higher, and the yield on the 10-year Treasury exceeded 2.9% last February. The yield on the 10-year Treasury peaked at 3.1% on May 17, 2018 before ending the second quarter at 2.85%.
Investors continue to ask, what should be expected next? Some Wall Street analysts are forecasting the yield on the 10-year Treasury to approximate 3.3% at the end of this year. Others are predicting a year-end yield of 2.3% for the 10-year Treasury, or a full 1% lower.
This disparity reflects varied expectations for economic growth in the second half of 2018. Some analysts are expecting robust levels of growth, both in the USA and abroad, and others are not. In a Bloomberg survey at the end of June, 9 of 11 prominent analysts expected year-end yields to approximate or exceed 3% for the 10-year Treasury – a forecast that reflects bullish expectations for economic growth.
Similarly speaking, many analysts expect the second quarter’s gross domestic product to grow at an approximate rate of 4%, which would be up sharply from the 2% growth seen in this year’s first quarter. Such growth would suggest another strong quarter for corporate earnings. In fact, S&P and Dow Jones indices have projected 2018’s second quarter operating earnings to increase by 27% over 2017’s second quarter levels for the S&P 500 companies.
However, our President and this administration have been aggressively confronting world trading practices and leveling tariffs on many countries’ exports to the United States. These steps reflect campaign promises President Trump made along with his voiced displeasure towards the World Trade Organization. The WTO was organized in 1995 to succeed the General Agreement on Tariffs and Trade, or GATT, which was signed by 23 nations in 1947.
Today, 164 countries are members of the WTO, but there are only 47 full members. And in the WTO’s most recent annual report, published 5/31/18, they state “Changes to the rules of trade require the agreement of all WTO members, who must reach consensus through negotiations.” The report also states that “about 50% of the specific trade concerns raised with the WTO since 1995 have been either completely or partially resolved.”
There are also Special and Differential Treatment Agreements, or S&D’s, that give developing countries, including China, special rights to implement full WTO agreements over extended periods of time. And while there are “evidence-based dialogues” to determine a country’s shortfalls and needs, the WTO is dependent on self-regulation from all its members to list any and all national subsidies. The WTO is a deliberative body, not an international regulator.
The Annual Report also describes “a chronic low compliance” and an increasing level of disputes among members which “rose by 20% in 2017” over 2016 levels. Settling these disputes is the responsibility of the Dispute Settlement Body, led by 7 Members of the Appellate Body. But this Appellate Body hasn’t functioned with a full staff for over a year. And negotiations about agricultural subsidies and anti-dumping issues have persisted for over a decade. The United States also continues to be the largest financial supporter of the WTO and contributed more than $22B to fund it in 2018.
President Trump’s displeasure with the WTO appears to have grown since he was elected, and as a result, the entire world is now witnessing his negotiating tactics on international trade. Very few like his approach, the tariffs he has levied, those he has threatened, and the trade restrictions he has proposed for Asia, Europe, and North America. Such steps have been countered by Canada, the Europeans and others, which have increased the costs of goods sold for all of us.
Nobody wins a trade war. The retaliatory steps taken thus far may slow the world’s economic growth. But our President appears to believe he can use tariffs and investment restrictions as a way to negotiate fairer trade for the United States. Positive results have yet to be seen. But through the second quarter, the U.S. stock market gave the administration the benefit of the doubt. Again, global negotiations on trade are just beginning, and there will be many more twists and turns down the road. The pronouncements, the reactions, the shocks, and perhaps even some pleasant surprises, will all impact world stock markets over the next few months.
But with only 12% of the United States’ economy dependent on exports, the U.S. economy may be better able to withstand this storm. By comparison, the European Central Bank also calculated that 27% of Europe’s gross domestic product is dependent on the export of goods and services. In China, that number is 21%. And Europe and China’s economies have also been slowing more recently, versus the United States’ economy which has continued to grow.
Many companies will be affected however, as we’ve seen from recent announcements by Mercedes Benz AG, Harley-Davidson Inc., and the General Motors Company. Tariffs and investment restrictions have impacts, particularly since so many supply chains cross international borders these days.
However, the negotiations continue, and solutions may still be found. For instance in June, Germany’s largest auto makers advocated that all import tariffs go to 0% on cars shipped between the U.S. and Europe. And China could propose a reciprocal investment treaty with the United States to bring more investors into China and help broaden their restricted markets. President Trump has also suggested that the United States create a tariff-free zone with Europe and other countries. Hopefully, the world’s trading negotiators will find similar solutions.
Yet as these issues are being debated, investors need to understand how their portfolios may be impacted. For instance, the FANG stocks and technology companies could have the most to lose from a full trading war. That’s because 57% of the technology sector’s revenue comes from overseas, according to Standard & Poor’s.
In contrast, Standard & Poor’s calculated that companies in the telecom, financial, and consumer staples sectors all get less than 35% of their revenue from foreign countries. Those market sectors have not performed overly well in 2018, but they may offer defensive protection for an investor’s portfolio.
Accordingly, we continue to believe that a balanced portfolio with diversified holdings remains the best way for investors to grow and protect their productive assets. Do let us know if you have any questions, or would like to visit.
Enjoy your summer!
Securities noted above valued as of the market close on June 29, 2018:
Alphabet Inc. (Google’s Holding Company) (GOOGL $1,129.19)
Amazon.com, Inc. (AMZN $1,699.80)
Facebook, Inc. (FB $194.32)
General Motors Company (GM $39.40)
Harley-Davidson, Inc. (HOG $42.08)
Netflix Inc. (NFLX $391.43)
Tesla Inc. (TSLA $284.80)
The above summary/prices/quotes/statistics contained herein have been obtained from sources believed to be reliable but are not necessarily complete and cannot be guaranteed. Errors and omissions excepted.