View PDF Version of Newsletter
April 4, 2018
Robert Bingham, CFA, President and Chief Investment Officer
John Wright, Principal, Director of Research
“There is a huge difference between an inexorable slide towards de-globalization and an outright trade war. The former is inevitable and the latter is unlikely.”
– Viktor Shvets, Macquarie’s Head Asian Strategist on 3/27/2018
After the very strong markets in 2017, this year’s first quarter had some hiccups, and delivered lower rates of return. For the first three months, the S&P 500 Index fell by 0.8% and the Dow Jones Industrial Average fell by 2.0%, when including dividends. The bond market also declined as measured by the ICE BofA Merrill Lynch U.S. Corporate & Government Bond Index which fell by 1.6% in the first quarter.
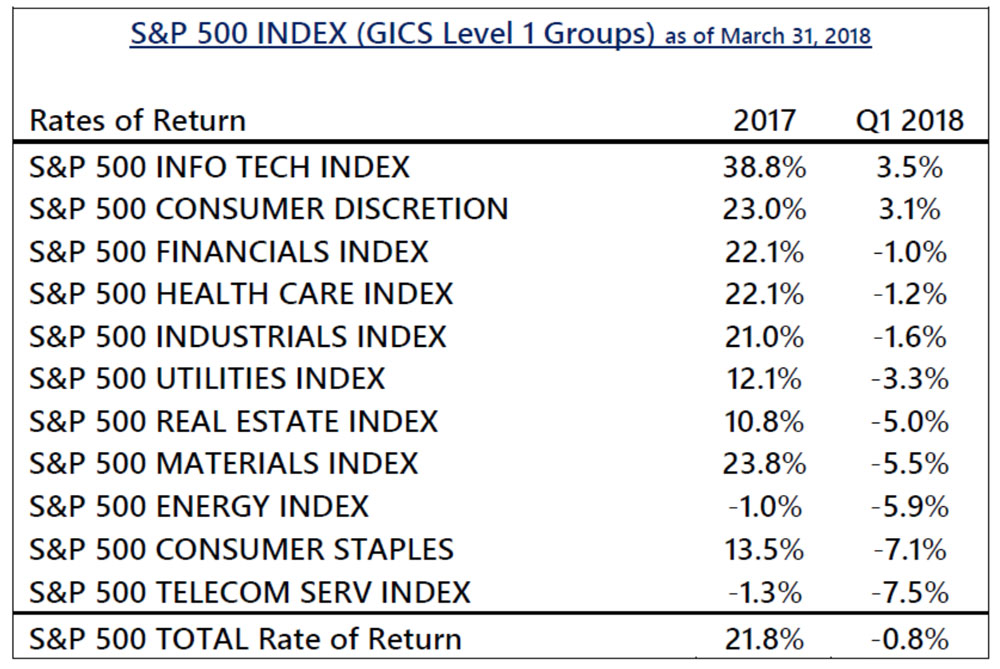
One can see from the adjoining table that only 2 of the 11 industry sectors in the S&P 500 had positive returns during the first quarter. And despite recent troubles at Facebook, Tesla, and Amazon, the technology and consumer discretionary sectors still managed to outperform and deliver positive returns for investors. In contrast, the consumer staples and the telecommunication sectors declined by over 7% in the first quarter, even when including dividends. The negative returns in these sectors reflect concerns that interest rates are headed higher and that future earnings and dividends may not be worth as much in a higher interest rate environment. The weak results for the entire market reflect questions that the economy’s strong growth rate may be slowing. In February, stock prices fell 11.8% from the all-time highs seen in January, and then prices bounced back a bit in March.
Market volatility also made a noticeable comeback after the benign trends that were enjoyed over the last few years. The Chicago Board Options Exchange Volatility Index, or VIX, traded between 10 and 15 for much of the last two years. Yet in the last two months, the VIX traded between 15 and 35 for most of the time.
Swings in the stock market became much more noticeable in February and March. For instance, in the last 10 trading days of March, the S&P 500 Index moved in value by 2% or more, 50% of the time. Such bounces get reflected in a higher VIX index, and can lead investors to question their underlying expectations for the stock market. But as we’ve written before, more volatility should be expected as underlying growth trends have changed and interest rates have moved higher.
While it may be easy to blame our country’s President for the increased turbulence in the markets, we would argue that investor uncertainty about interest rates, growth rates, inflation and government policy have all combined to increase the turbulence. Fundamentally, markets try to quantify and assess future growth rates. New expectations for interest rates, commodity prices, labor costs and inflation all impact future expectations for growth. Changing government policies can also increase uncertainty – as we’ve seen with the newly-imposed tariffs on imported steel, aluminum and Chinese goods. But the steel and aluminum tariffs were rolled back sharply before they were implemented, and the Chinese tariffs have not yet been implemented.
Other concerns about Facebook and the technology sector have also brought more uncertainty into the stock market after questionable marketing and data-sharing practices came to light. Investors are now beginning to wonder if new government regulations will be leveled on these fast-growing companies. But we need to remember that change is always ever-present in the market. Uncertainty will always fluctuate, and sometimes increase, as market variables change and markets recalibrate risk. Rarely do investors, individuals, or the markets measure and weigh all the variables the same way.
At the beginning of February, the markets were surprised at the strong level of new job growth and a jump in unit labor costs in the United States. All of a sudden, markets began to believe that interest rate moves might need to be greater than anticipated due to the stronger levels of growth and inflation that were reported.
This fear followed the very strong corporate earnings reports that were released in January. The strength of these reports helped direct the S&P 500 and Dow Jones Indices to new record highs. That said, this stronger-than-expected growth also led many investors to question whether the Federal Reserve would have to be that much more aggressive with its plans to raise interest rates in 2018, which contributed to the market’s subsequent volatility.
As April began, both the stock and the bond markets were still trying to assess what level of growth should be expected in 2018. FactSet Research projects that reported corporate earnings for the 1st quarter will increase 17% over the 1st quarter levels of 2017. Such growth may set new records and would certainly add momentum to the economy’s strong growth seen in 2017.
However these 1st quarter results will also reflect the lower tax rates that resulted from the Tax Cuts and Jobs Act that was passed in December, 2017. If these earnings are adjusted for comparative tax rates, then some analysts have estimated that the 1st quarter’s growth rate will “only” be 11%. Either way, 1st quarter corporate earnings are expected to be very good. Job growth trends and consumer confidence levels are also expected to stay strong. Indeed, as the adjoining graph shows, consumer confidence levels and the gauge of present business conditions have not been this strong for nearly 20 years.
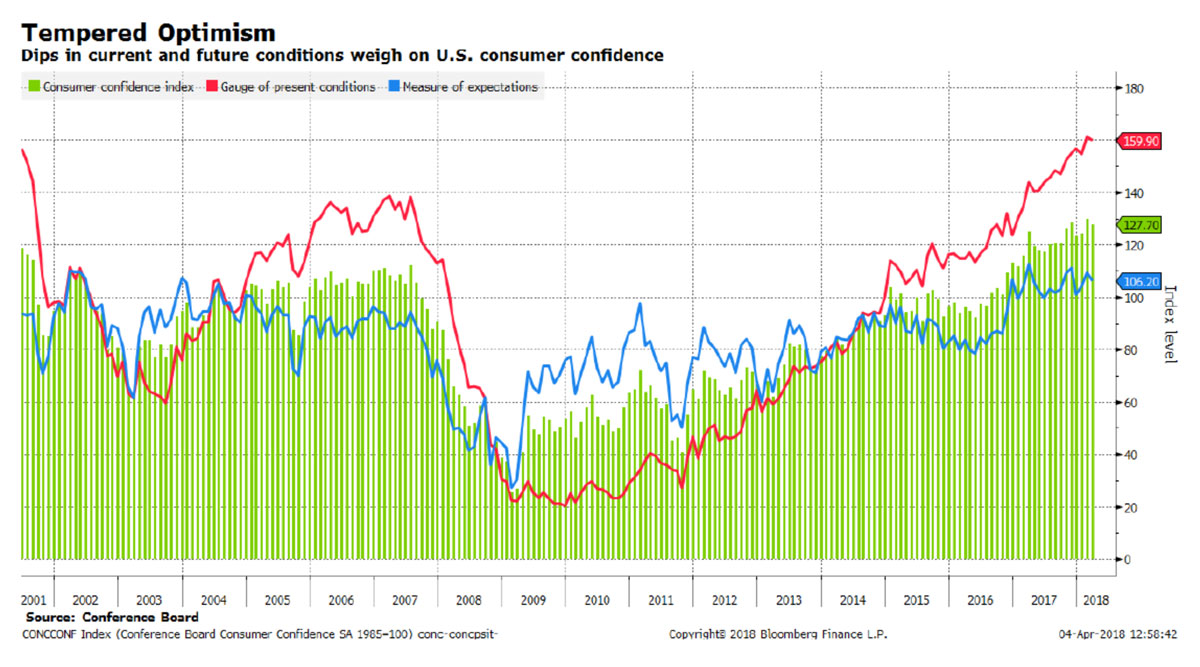
Such levels of consumer confidence reflect the strong job growth and the improved earnings prospects for both individuals and businesses. Perhaps this improved business climate will be able to absorb the higher tariffs on imported goods; or perhaps the economy’s growth rate will decline from burdensome tariffs and incremental regulation on the technology sector. Maybe tariffs are just being used as negotiating tools for an evolving strategy on international trade. Either way, market uncertainty has increased, and it’s natural that market volatility levels have increased as well.
It’s also possible that some of the inequities that have been built into the World Trade Organization’s operating practices could change. For instance, why do U.S. car manufacturers pay 10% tariffs on cars shipped to Europe, while European manufacturers pay 2.5% tariffs on cars imported into the United States? And why does Tesla pay a 25% tariff on its cars shipped to China, while Chinese manufacturers pay 2.5% tariffs on their cars imported here? Obviously, no one benefits from a global trade war. And hopefully, our world’s trading negotiators understand this and will sit down for discussions on these many issues.
Accordingly, most economists still expect double digit growth rates for all of 2018 and 2019. While the strong earnings numbers may be supported by lower tax rates, most businesses will have greater cash flow and flexibility to expand operations, pay their employees more, and/or increase payments to shareholders. Greater disposable income helps everyone.
Strong expectations however can also lead to sharp disappointments. And April will bring many earnings reports and economic data for the markets to digest. The Federal Reserve also has two meetings scheduled in the 2nd quarter. So, all of us will get more information to help us assess future possibilities and valuations.
Such data will help shape the technical correction that the stock market has experienced this year. Yet the market’s lower values have brought lower stock prices that were much more reasonably priced on April 1st than they were last January. In fact, on April 3rd, the S&P 500’s price/earnings ratio for future earnings was 16.1, or 13% below from where it was at the beginning of this year, according to Bloomberg’s equity strategists. And a forward P/E of 16 for the S&P 500 often brings buyers back into the market. Stay tuned.
Do let us know if you have questions or would like to visit. Happy spring!
Securities noted above valued as of the market close on December 31, 2017:
Amazon.com (AMZN $1,392.05)
Facebook Inc. (FB $156.11)
Tesla Inc. (TSLA $284.80)
The above summary/prices/quotes/statistics contained herein have been obtained from sources believed to be reliable but are not necessarily complete and cannot be guaranteed. Errors and omissions excepted.