View PDF Version of Newsletter
January 8, 2019
Robert Bingham, CFA, President and Chief Investment Officer
John Wright, Principal, Director of Research
“What matters now is not so much a deterioration in data, but rather how far it deteriorates relative to current negative expectations.”
– Goldman Sachs’ Chief Equity Strategist, Peter Oppenheimer on 1/7/19
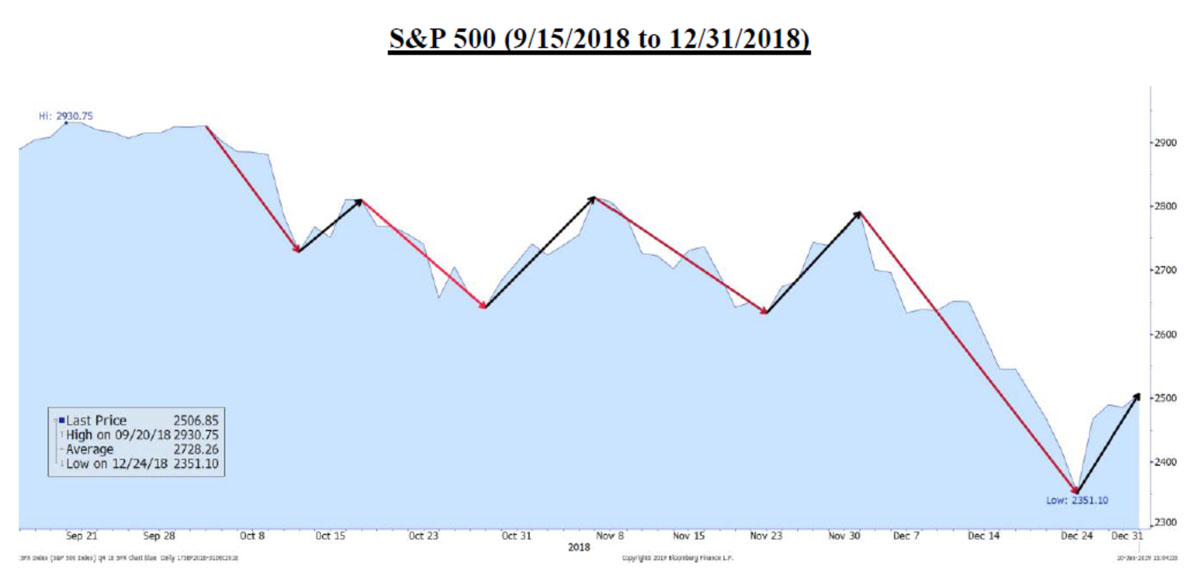
What a doozy! The 4th quarter of 2018 earned a place in stock market lore as volatility returned with a vengeance. Not only did the stock market decline in the quarter, but it also had many sharp twists and turns. From peak to trough, the S&P 500 Index fell 20.2% from September 21st to December 26th. However, when using end of day market prices, the S&P 500’s fall measured 19.8% from its peak.
Equally challenging were the inter-day swings and sharp rebounds following the sharp declines. In four different fifteen-day stretches during the quarter, the S&P 500 fell by 7% or more, with a 16% decline seen between December 3rd and December 26th. And on one day, December 26th, the S&P 500 rallied over 5% from its low on that day. There were also four rebounds of 6% on average seen during the 4th quarter.
The graph below depicts these absolute moves in the S&P 500 Index during the 4th quarter.
Furthermore, for the 21 previous trading days through January 4th, the S&P 500 Index traded in an intraday range that exceeded 2% on 15 of those 21 days, or virtually for all of December. According to Bloomberg Finance, that period was the most volatile trading month for the S&P 500 over the last seven years. The NASDAQ 100 Index also moved up or down by 3% or more in four of the nine trading days between December 21st and January 4th. Investors were whipsawed multiple times in 2018’s 4th quarter.
These gyrations left the S&P 500 Index down 13.5% for the 4th quarter and down 4.4% for all of 2018 when including dividend payments. In contrast, the bond market gained 0.9% for all of 2018 as measured by the Bloomberg Barclays US Treasury Index.
Overall, there were not many “safe havens” in which to hide during 2018. Virtually all industry sectors of the S&P 500 declined during 2018, as did markets in Europe, China and Japan, all of which performed noticeably worse. The Wall Street Journal reported that the average U.S. stock fund declined by 7.7% in 2018 while the average international stock fund fell by 15.5%.
The best asset class of 2018 was cash, which increased in value by 1.8% according to Dr. David Kelly, JPMorgan’s Chief Global Strategist. Hence, 2018 was a reminder that investors should always maintain an adequate level of cash to protect against those unwanted surprises or to fund annual spending needs. SKY Investment Group has always stressed that a portfolio should generate a reasonable amount of cash flow every year to help cover annual cash flow needs.
But for the last fifteen years since 2004, the annual rate of return on cash has been 1.3%, compared with the 7.8% annualized return for large-cap stocks. Clearly, with inflation at a 2% level, there is a real cost to holding too much cash and having assets lose purchasing power. Again, this is why SKY Investment Group has always stressed the importance of having well-balanced portfolios.
So: what to do going forward, and what do we make of this volatile 4th quarter? A short answer is that a recession looms and the market priced in the probability of an economic downturn. Yet as of January 7th, this probability, as measured by multiple sources, remained less than 20% for 2019. Was the market’s sell-off justified? Was it premature? Or is it still too early to tell?
A more comprehensive answer is that the United States’ economy is in transition from unusually high growth rates to more normal growth rates. Specifically, our country’s gross domestic product grew at an averaged 3.3% rate for the first three quarters of 2018 (the fastest rate of annual growth since 2005). That compares to a 2.2% growth rate for 2017 and a 1.6% rate for 2016. Bloomberg Economics is forecasting a 2.9% rate of growth for 2018’s 4th quarter and a 2.4% growth rate for 2019. Such growth remains very respectable and materially better than that generated in 2016.
On a $21 trillion economy, an additional 1% of GDP generates more than $200 billion in commercial activity. Such growth would continue to support more job growth, business expansion and economic opportunity. Such growth would also continue to encourage more workers to rejoin America’s labor force, as was seen in the January 4th Labor Department Report when 419,000 additional workers joined the December work force. There were also 312,000 new jobs created in December.
This economic growth has been real and has benefitted a lot of people. But is it sustainable? Clearly, the 2017 tax cuts provided some impetus. Yet some argue that legislation may only provide a one-time jolt. That said, Americans’ participation rate in the labor force has climbed to 63.1% which is the highest since 2013. More workers improve household incomes, increase consumer spending, and grow businesses. The unusually strong level of Christmas holiday sales reflects this expanding economy.
Yet a recession is still possible. The January 3rd report from the Institute for Supply Management showed that American manufacturing growth slowed in December. The expansion of the U.S. services industry also slowed in December. America is still negotiating tariff disputes with China and others, and world levels of international trade have declined accordingly from year-ago levels.
For countries like Taiwan, South Korea, Mexico, Canada and China, where exports exceed 20% of their GDPs, this slowdown of international trade matters materially. For America, where exports comprise only 8% of GDP, international trade is less of an issue. Consequently, gross economic product for most countries across the world has slowed markedly. Such contraction hurts everybody, including the United States. These tariff disputes do need to be resolved.
China, in particular, needs to get these trade disputes resolved. As their economy has grown, so has their dependency on the U.S. dollar. Since 2008, China has increasingly financed their growth with foreign debt. And much of this debt was financed in dollars, since U.S. debt financing was cheaper than financing that debt in China. Daiwa Capital Markets has estimated that China funded some 30% of their GDP with foreign borrowings. They also financed their Belt and Road Initiative to expand their international presence with foreign borrowings. Many of these debts need to be refinanced in 2019 and 2020.
Bloomberg’s Christopher Balding believes that, “China’s external debt has been increasing by an average of $70 billion per quarter since the beginning of 2017.” The Wall Street Journal’s Nathaniel Taplin has also calculated that, “China’s net spending on foreign services, mostly tourism, surged from $50 billion to more than $80 billion,” annually since 2015. The country’s trade surplus has also shrunk as a result.
China’s increased spending on consumer products, internal infrastructure and international expansion has exceeded its internal savings rate for several years now. Retail sales in China during December dropped to their lowest levels in more than 15 years; its manufacturing sector contracted in December as well. This recent economic slowdown becomes that much more painful if the country is overextended financially.
Hence, China’s incentive to negotiate with Washington appears to have increased. And JPMorgan’s David Kelly predicts an agreement on tariffs will be reached by June of 2019. Such an agreement could benefit other countries as well, fuel incremental trade growth and help support world capital markets.
Stock market volatility can also change investor behavior by reducing interest in funding long-term projects and expanding business operations. Additionally, the U.S. economy could be vulnerable to such a contraction if business leaders choose to postpone plans for incremental capital spending. Fortunately, the Federal Reserve has stated that they are monitoring the capital markets and will include market changes as they determine future policy. As Federal Reserve Chairman Jay Powell said on January 4th, “There is no preset path for policy.” Hence on January 7th, the Fed-fund futures only ascribed a 7% chance that the Federal Reserve would raise interest rates before June 19th. More importantly, increased flexibility on the part of the Federal Reserve should help calm the capital markets as policy is set in 2019 and 2020.
Although the stock market seemed to decree in 2018 that a recession is pending, no material indication of that has yet surfaced in the United States. Yes, global economies have slowed, and yes, this slowdown will negatively impact American companies. Indeed, negative pre-releases were issued by Apple, Delta, FedEx, Ford and Tesla for January’s earnings releases. Perhaps more negative surprises will surface. But no deluge of negative pre-releases had been issued as of January 7th, and fundamental economic trends in the United States looked solid as January began.
With the corporate earnings season beginning anew this month, we should expect the markets to parse every word from company CEOs as they talk about their companies’ earnings prospects. Investors will scrutinize, and perhaps find undue importance in comments made as the markets judge just how concerned investors should be about those earnings prospects. Such scrutiny will most likely also keep market volatility levels high in 2019. Pronouncements out of Washington D.C. should also be expected to contribute to this volatility. We may also receive more positive surprises, such as the Danaher Corporation’s announcement that its core revenue growth in the 4th quarter exceeded expectations, or Verizon Communications’ and the General Motors Company’s positive comments.
As always, we will continue to monitor the markets and the companies in which we invest to look for breaks and opportunities. As of January 7th, Wall Street’s analysts had lowered earnings forecasts for the S&P 500 companies in 2019 to 8% while also projecting sales revenue growth of 7% in 2019. Yet these projections can change with a heartbeat, so it’s wise to take these projections with a grain of salt. Analysts are also projecting a slowing trend in 2020 with only a 4.5% growth rate in that year’s revenue. Much is still to be determined.
Nonetheless, the decline in 4th quarter stock prices has given us cheaper stocks and the opportunity to reevaluate all portfolios. These price reductions also provide an opportunity to improve the quality of the companies owned in portfolios and make changes accordingly. Our work continues.
Do let us know if you have any questions or would like to visit further. We do hope you all enjoy a Wonderful New Year!
“As volatility settles down, prices settle up.”
– JPMorgan’s Chief Global Strategist, Dr. David Kelly on 1/4/19
Securities noted above valued as of the market close on January 8, 2019:
Apple Inc. (AAPL $150.75)
Danaher Corporation (DHR $103.43)
Delta Air Lines, Inc. (DAL $47.47)
FedEx Corp. (FDX $167.02)
Ford Motor Company (F $8.37)
General Motors Company (GM $34.81)
Verizon Communications Inc. (VZ $58.38)
The above summary/prices/quotes/statistics contained herein have been obtained from sources believed to be reliable but are not necessarily complete and cannot be guaranteed. Errors and omissions excepted.